Stonehenge
Sighting the Sun
by Clive Ruggles and Amanda Chadburn
Supplementary online materials
Technical data
Contents of this page:
The date difference (time interval) between the construction of the timber settings and later henge at Woodhenge
As explained in Ch. 6 note 14, to calculate the probability that the time interval falls between t1 years and t2 years, drop vertical lines down from the curve shown in Fig. 6.6 at t1 and t2 and calculate the area of the column beneath the graph. Taking the area under the whole graph to be 1.0, the area of the column will give the probability that the time interval falls between t1 and t2. The examples below illustrate this for a time interval between 100 and 300 years (t1 = 100, t2 = 300), between 150 and 300 years (t1 = 150, t2 = 300), and between 150 and 250 years (t1 = 150, t2 = 250).
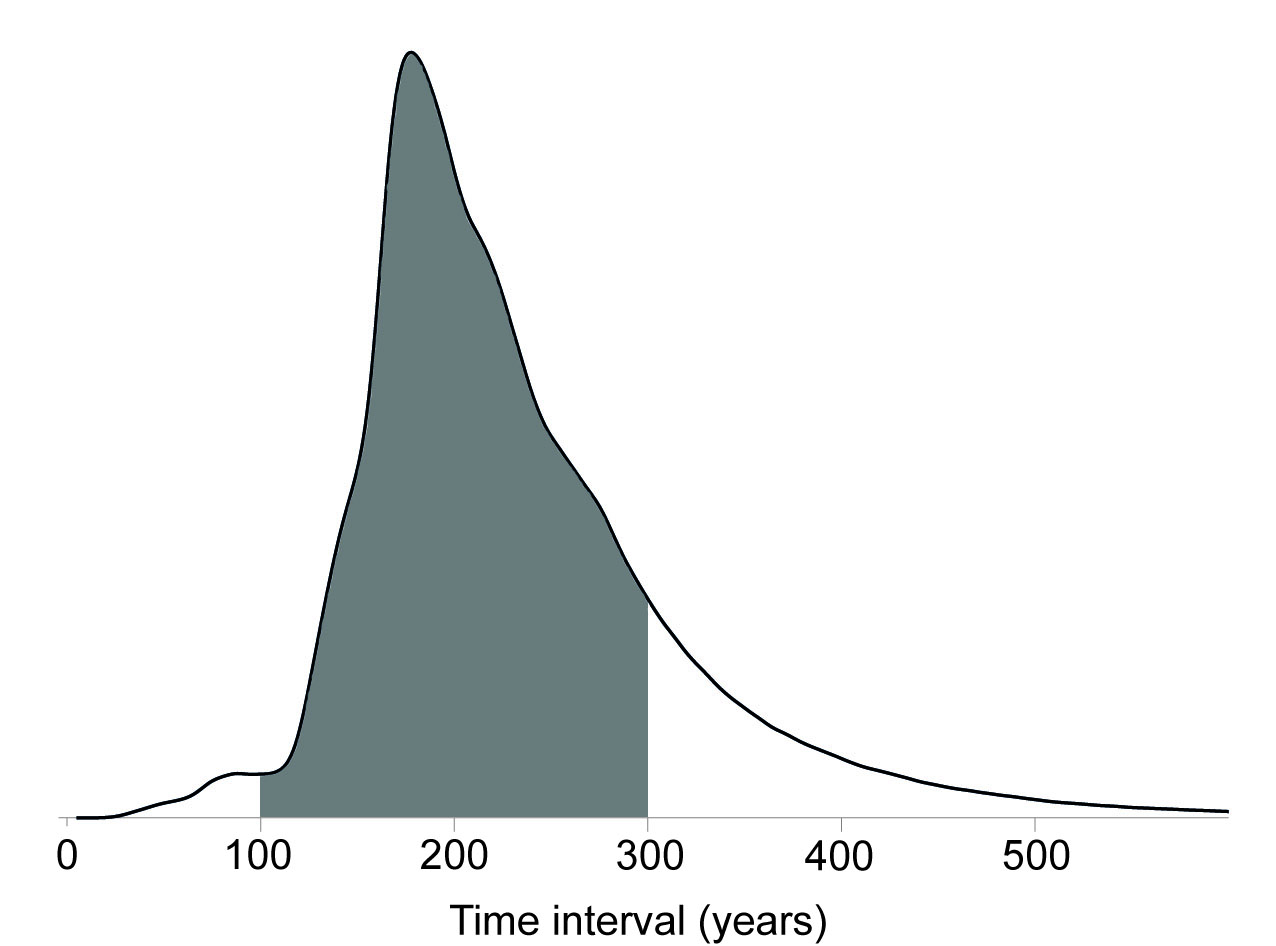
Probability that time interval is between
100 and 300 years = proportion of area
under graph that is shaded ≈ 0.8 (c. 80%)
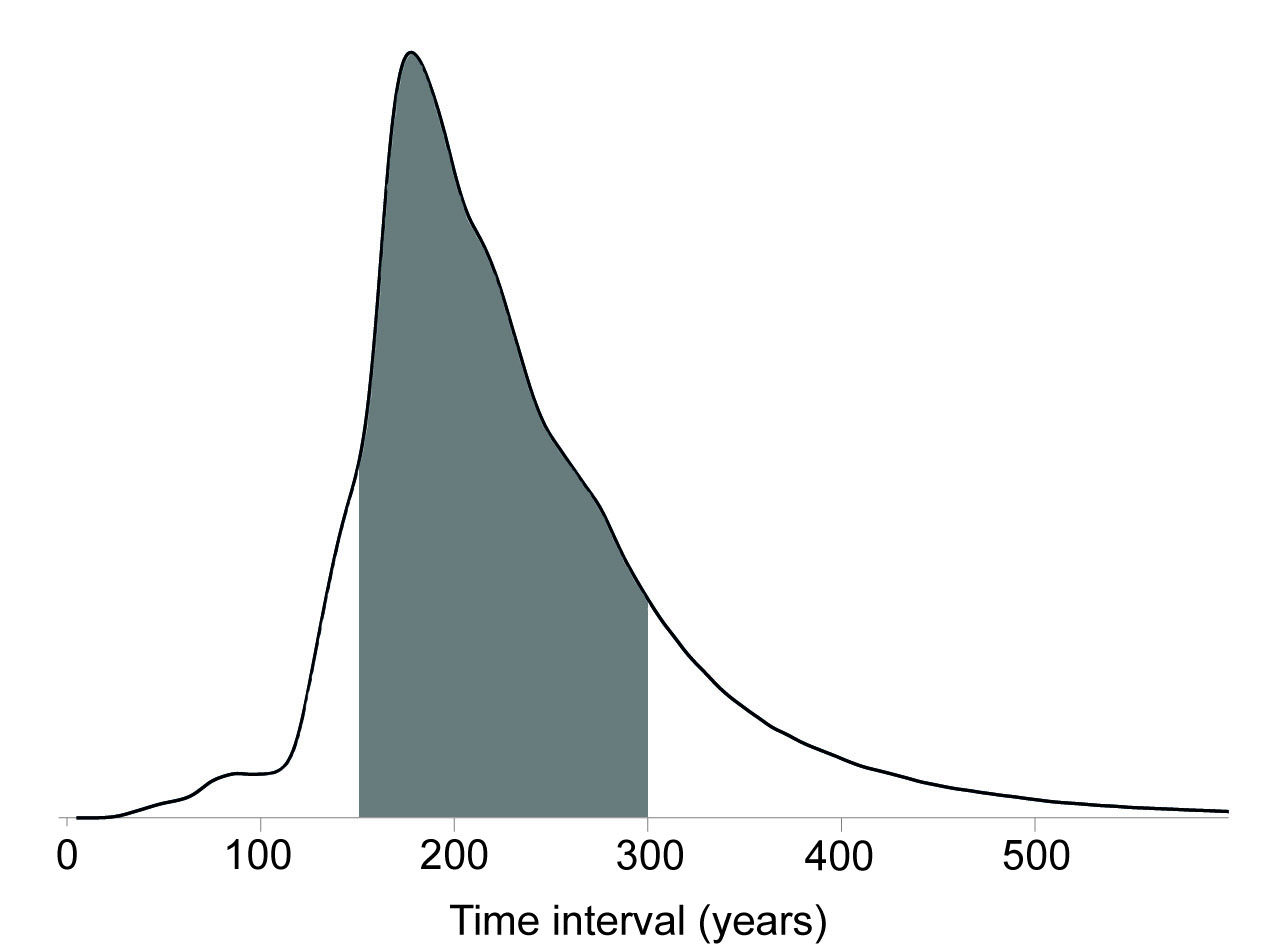
Probability that time interval is between
150 and 300 years = proportion of area
under graph that is shaded ≈ 0.6 (c. 60%)
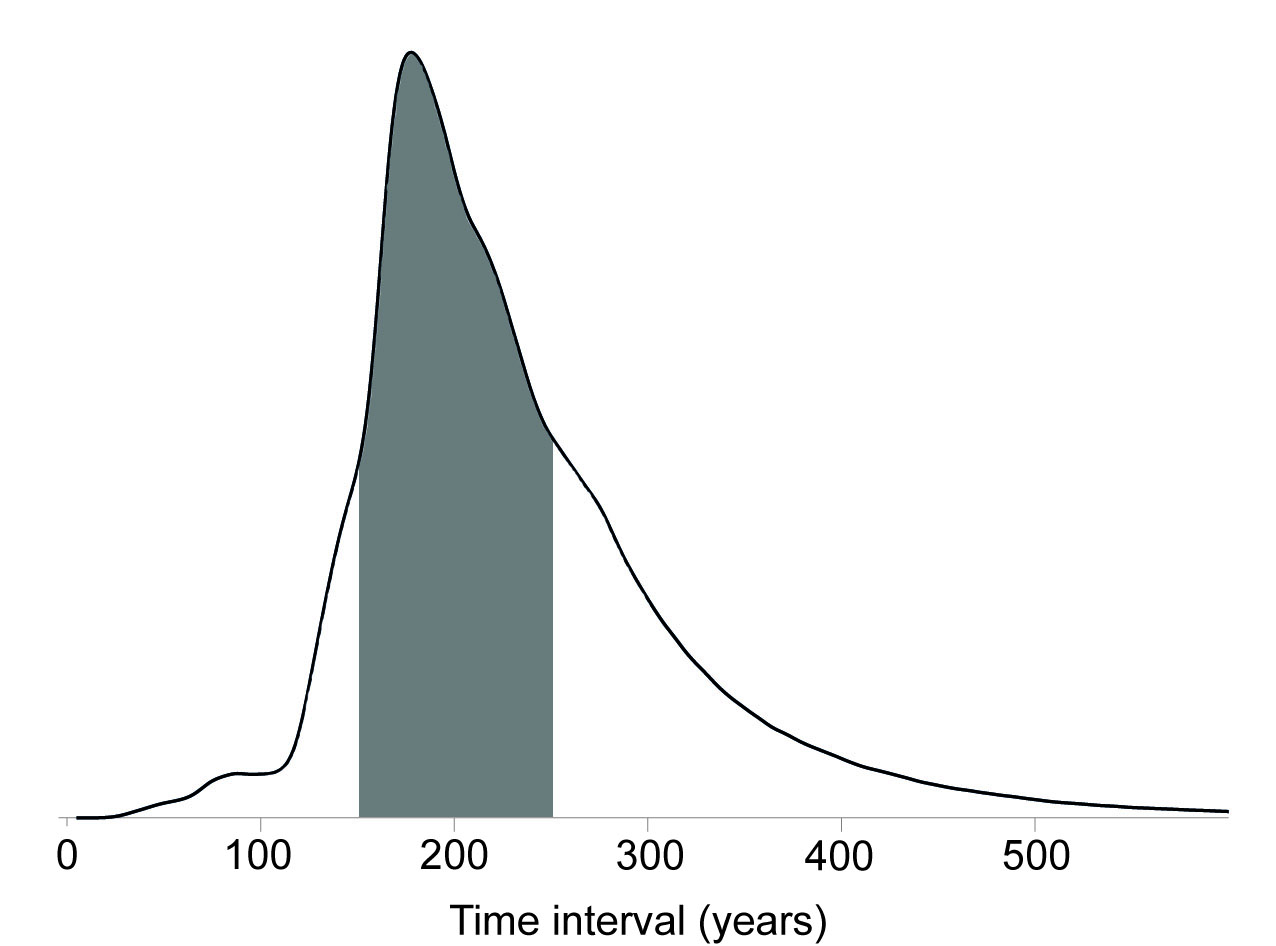
Probability that time interval is between
150 and 250 years = proportion of area
under graph that is shaded ≈ 0.4 (c. 40%)
Removing the A345 from the Durrington Walls DTM
As mentioned in Ch. 6 note 26, Andrew Smith of the University of Adelaide kindly developed a tool that enabled the A345 road and its embankment (and also the old A345 road) from the LiDAR digital terrain data shown in Fig. 6.10. Doing this essentially involves two main steps:
- Identify the road itself, its embankment and other disturbed ground on each side.
- Replace with relevant pixels concerned with values interpolated from the ‘pre-existing’ ground level in the surrounding landscape.
For step 1, the original DTM is converted into a viewable bitmap (e.g. a TIFF image) and loaded into Photoshop. A mask can then be painted over the pixels to be replaced, and the result saved as a new TIFF image.
For step 2, this new TIFF image is read into a program which interpolates across the limits identified by the mask.
In the case of Durrington Walls we are able to take advantage of the fact that the A345 on its embankment runs almost N-S through the henge, so that the interpolation algorithm can be applied on E–W ‘slices’.
Anyone interested in more details of the generic method is invited to contact Andrew directly.
The solstitial sightlines
The technical data for the solstitial sightlines (see Ch. 7 note 8) are sourced from CR’s paper “Interpreting solstitial alignments in Late Neolithic Wessex” published in the journal Archaeoastronomy: the Journal of Astronomy in Culture in 2006 (vol. 20, pp. 1–27). The following notes are taken from that paper.
Background
The work arose from CR’s involvement in the Stonehenge Riverside Project, and aimed
- to clarify the basic data regarding the axes of the principal Late Neolithic monuments in the Stonehenge area and their relation to solstitial sunrise and sunset;
- to investigate astronomical alignments and sightlines of possible significance in the wider landscape; and
- to inform the wider interpretations being developed as part of the Stonehenge Riverside Project as a whole.
In addressing the first of these aims, it was necessary to reexamine published surveys, excavation reports and plans as well as to undertake fresh fieldwork, taking into account new features and information revealed by the 2005 excavations, especially at Durrington Walls.
The requisite fieldwork was carried out during August and September 2005. Where necessary, surveys were undertaken using a Leica Total Station, the PB – Az (plate bearing minus azimuth) correction being determined from timed observations of the sun (Ruggles 1999, 167–8). In other cases a Silva Survey Master compass-clinometer was used, with a second prismatic compass providing a consistency check and error reduction being achieved for azimuth readings by sighting upon reference points whose location, and hence true azimuth, could be determined independently using maps and/or GPS.
In order to avoid overprecision—the tendency to quote measured azimuths or declinations to a degree of precision that is entirely unjustified given the nature of the putative alignments being investigated or the state of preservation of the archaeological remains—azimuths are generally quoted to the nearest 0.1°, or exceptionally to the nearest 0.05°.
Stonehenge: The Sarsen Monument, Station Stone Rectangle, and Avenue
Azimuths. Geometrical determinations of the sarsen axis are available from two independent sources. Cleal et al. (1995, 170) worked from a plan of the stones still standing in the sarsen circle, using CAD to determine its geometrical centre, and then determined the axis by projecting a line from this centre to the centre line of the avenue at its terminal just outside the enclosure ditch. The azimuth of this axis is not quoted, but it is marked on an accompanying figure (ibid., fig. 79). Projecting this onto a larger-scale plan (ibid., plan 1), which is georeferenced to the British National Grid, yields a grid azimuth of 48.4°/228.4° ± 0.2°, corresponding to a true azimuth of 48.5°/228.5° ± 0.2°.
In 1973, the Thoms carried out their own survey of the sarsen monument, including the trilithons (Thom et al. 1974; see also Thom and Thom 1978, 138–62). While their geometrical interpretation of the five trilithons as lying on an ellipse is highly questionable, their considerations of geometrical symmetry nonetheless provide an estimate of the axial orientation obtained from the sarsen monument itself. The azimuth they quote is 49.95°/229.95° ± 0.05° (Thom et al. 1974, 81; Thom and Thom 1978, 145).
Working from both Cleal et al.’s and the Thoms’ plans, Ranieri (2003) used computer techniques to determine the orientation of the best-fit rectangle to the four Station Stones. He obtains an azimuth of 49.8°/229.8° ± 0.2°.
Various estimates are available of the orientation of the straight section of the Avenue leading from the terminal at Stonehenge 530 m NE to the ‘elbow’ in Stonehenge Bottom (see p. 59), but they produce surprisingly inconsistent results. Attempts to determine the orientation by direct measurement are limited in accuracy owing to the poor surface visibility of the parallel ditches and banks. The first theodolite measurement was by Lockyer (1909, 65–6), who obtained 49.6° ± 0.1° (actually 49.65° near the terminal and 49.55° near the elbow), while Atkinson (1978) obtained 49.9° ± 0.05° (actually 49.87° for the NW ditch from end to end and 49.94° for the SE bank) (see also North 1996, 235). Cleal et al. (1995, plan 3) supply a plan, at 1:5000 scale, georeferenced to the British National Grid, showing the positions of excavations both at the terminal and the elbow, and the line of the avenue extrapolated between them. The grid azimuth obtained from this plan is 49.3°/229.3° ± 0.1°, corresponding to a true azimuth of 49.4°/229.4° ± 0.1° and therefore closer to Lockyer than Atkinson. On the other hand, CR’s own compass-clinometer and GPS measurements in 2005 (50.2°/230.2° ± 0.4°) are broadly consistent with Atkinson’s figures. On the basis of these data, it seems unwise to claim that the accuracy to which the azimuth of the Avenue is currently known is any better than about ± 0.3°, with the safest mean figure being about 49.7°.
Altitudes. The horizon altitude in the direction of midsummer sunrise is not now directly determinable because of intervening trees, but the Thoms (Thom et al. 1974, 84; Thom and Thom 1978, 150) obtained a value very close to 0.6°, in agreement with Lockyer (1909, 67). None of these authors was concerned with the horizon in the opposite direction, but DTM data yield a figure of 0.5° ± 0.05° which concurs broadly both with North’s (1996, 459) estimate of 0.4° and with clinometer measurements taken by CR.
The azimuth and altitude data are summarized in the Table below. All angles are in degrees.
| Structure defining orientation | Azimuth | Altitude to SW | Altitude to NE |
|---|---|---|---|
| Between centre of sarsen circle and middle of Avenue at terminal | 228.5/48.5 ± 0.2a | 0.5 ± 0.1 | 0.5 ± 0.1 |
| Avenue between terminal and ‘elbow’ | 229.7/49.7 ± 0.3b | 0.5 ± 0.1 | 0.6 ± 0.05 |
| Station Stone rectangle | 229.8/49.8 ± 0.2c | 0.5 ± 0.1 | 0.6 ± 0.05 |
| Geometrical axis of symmetry of trilithon setting | 229.95/49.95 ± 0.05d | 0.5 ± 0.1 | 0.6 ± 0.05 |
Notes:
- a: From the axis marked on the published plan by Cleal et al. (1995, fig. 79, projected onto their plan 1).
- b: This best estimate is obtained by combining the following (see above): 49.6°/229.6° ± 0.1° (from Lockyer 1909), 49.9°/229.9° ± 0.05° (from Atkinson 1978), 49.4°/229.4° ± 0.1° (from Cleal et al. 1995), and 50.2°/230.2° ± 0.4° (Ruggles).
- c: From Ranieri 2003.
- d: From the published surey by Thom et al. 1974, 81. Those authors’ quoted accuracy.
The figures confirm that the azimuths of the Avenue, the Station Stone rectangle, and the geometrical axis of symmetry of the sarsen monument coincide to within about 0.3° and are possibly even closer. On the other hand, the centre line of the Avenue as it approaches Stonehenge does not align with the geometrical centre of the sarsen monument (see also North 1996, 406). This accounts for the aberrant figure obtained when attempting to define the orientation by joining the geometrical centre to the middle of the avenue at the terminal.
Hence the best estimates for the azimuths (49.8°/229.8° ±0.2°) and altitudes (+0.5° to the SW, +0.6° to the NE) of Sightlines 1 and 2 as quoted in the book.
Woodhenge
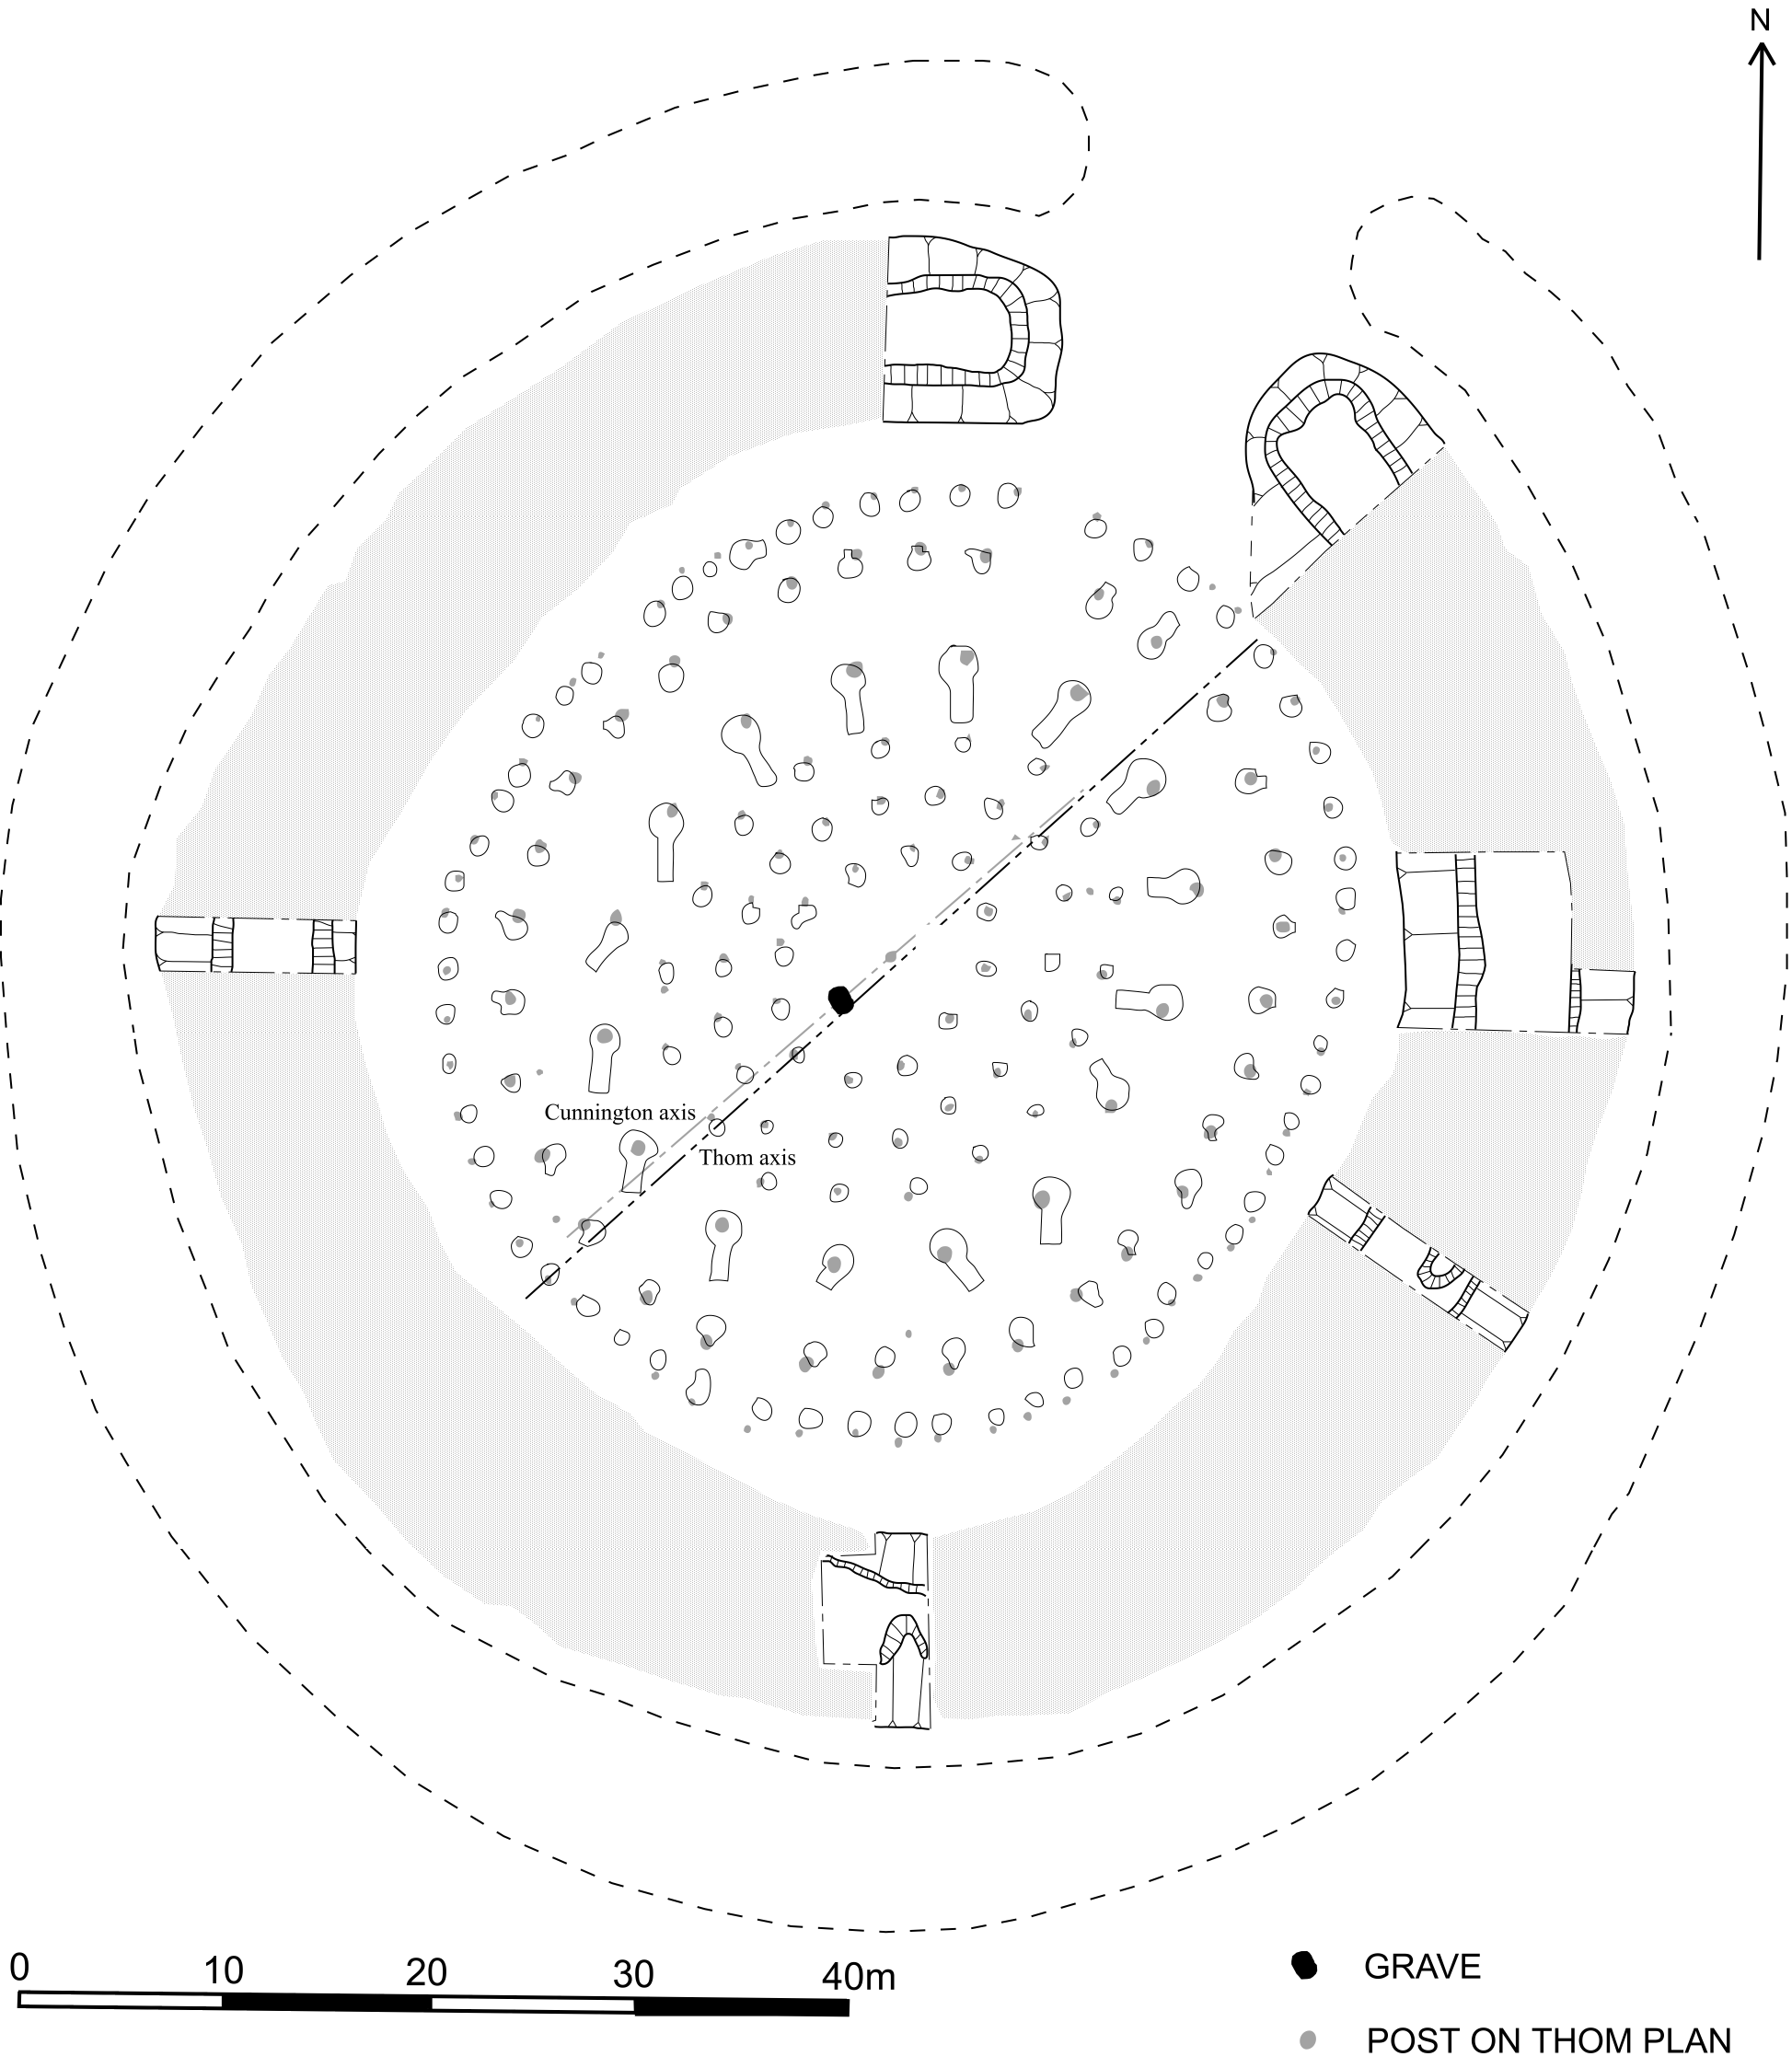
At Woodhenge, we use Cunnington’s pragmatically defined axis in preference to that of Thom, whose precise solstitial azimuth was pre-assumed as the basis for a geometrical construction that in any case was fitted to the positions of the marker posts rather than the centres of the actual excavated postholes (see pp. 87–88; p. 99 note 7).
Cunnington (1929, 9, footnote, and plate 4) quotes the azimuth of her line of sight (confirmed by theodolite measurements) as 50½°; our “±0.3°” reflects the remaining uncertainties in the exact position and orientation of the axis. She gives the horizon altitude as half a degree, which matches the +0.5° that we estimate from the DTM data. These figures yield a declination of +23.5°, as would be expected, since this is the declination of the centre of the solstitial sun in modern times: Cunnington’s conclusions were based on observations of the actual summer solstice sunrise (ibid., 9, footnote). In the opposite direction she gives the horizon altitude as one third of a degree, which again matches the estimate from the DTM data.
Thom reported his independent survey of the site in his book Megalithic Sites in Britain (Thom 1967, fig. 6.16). His axis is clearly marked, and the following measurements are marked on the plan: az = 49.2°, alt = 0.5°, dec = 24.2°. Unlike Cunnington, Thom could not survey the excavated postholes and instead surveyed the concrete marker posts that had been erected shortly ater Cunnington’s excavation. Despite the extreme care with which Thom undertook this survey (ibid., 73), it relies on the marker posts accurately corresponding to the centres of the excavated postholes, which was not always the case (see p. 87). His plan also ignores the central grave but includes a large concrete post erected in the centre that in fact did not mark a posthole at all (see p. 127). At first sight Thom appears to have obtained his axis geometrically, on the basis of his imposed geometrical construction of ‘egg shapes’. However, in the commentary it emerges that the axis was “chosen to be along the azimuth of the point on the horizon where the midsummer sun first appeared around 1800 B.C.” (Thom 1967, 73). In other words, Thom actually assumed the solstitial orientation to be the intended axis, and derived his geometrical constructions based on this assumption. Interestingly, when Thom’s plan is reproduced in Thom, Thom, and Burl (1980, 130), the same axial line is now labelled “az = 49.2, alt = 0.5, dec = 23.9 (sun at first appearance)”. The declination yielded by this azimuth and altitude, according to CR’s basic declination calculator, is the originally quoted +24.2°, corresponding to the upper limb of the solstitial sun.
The azimuth, altitude and declination data are summarized in the Table below. All angles are in degrees.
| Structure defining orientation | Azimuth | Altitude to SW | Declination to SW | Altitude to NE | Declination to NE |
|---|---|---|---|---|---|
| Cunningham axis | 230.5/50.5 ± 0.3a | 0.3 ± 1.0a | –23.7 ± 0.2 | 0.5 ± 0.3a | +23.5 ± 0.3 |
| Thom axis | 229.2/49.2 ± 0.1b | 0.3 ± 0.1 | –24.4 ± 0.1 | 0.5 ± 0.1b | +24.2 ± 0.1c |
Notes:
- a: Value quoted by Cunnington (1929, 9, footnote).
- b: Value quoted on Thom’s plan (Thom 1967, 74; Thom, Thom, and Burl 1980, 130) .
- c: This value, deduced from the azimuth and altitude using CR’s basic declination calculator, corresponds to the value quoted in the annotations on Thom’s plan as published in Thom 1967, 74 but not to the value quoted on the same plan reannotated as published in Thom, Thom, and Burl 1980, 130.
Durrington Walls: South Circle and Avenue
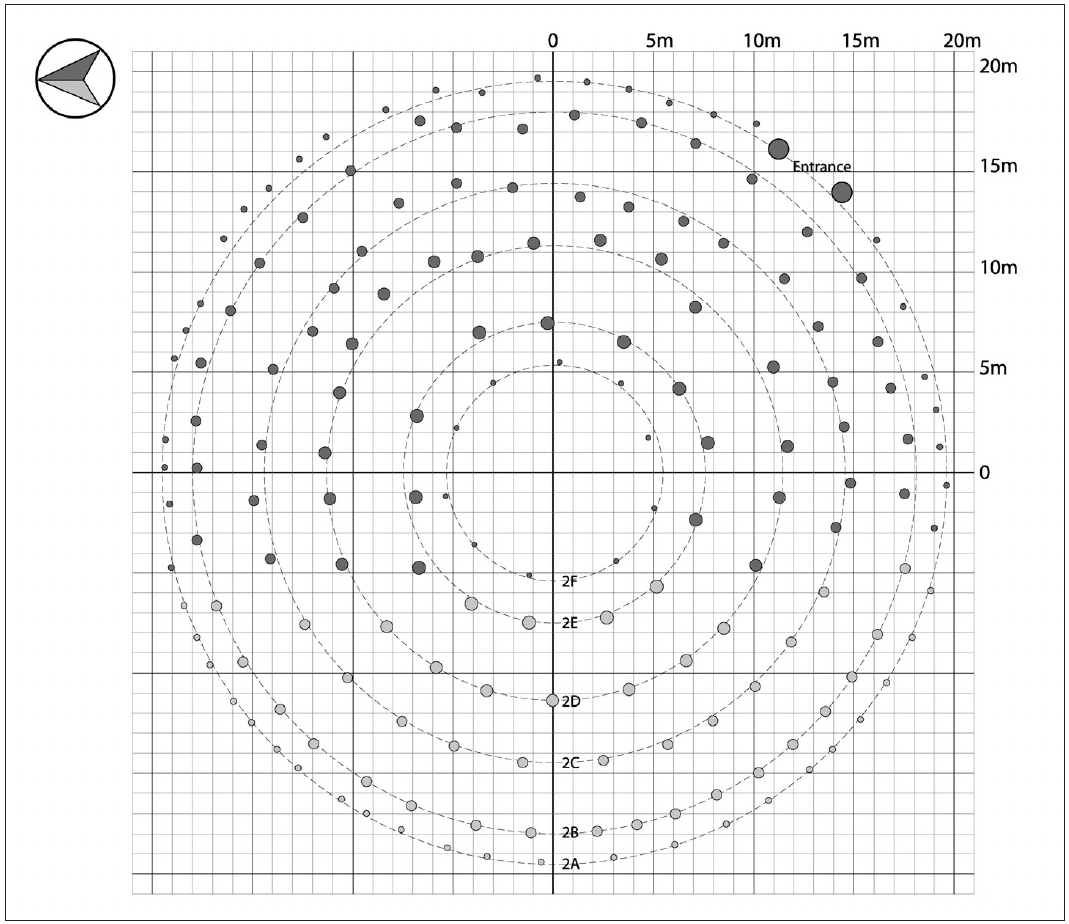
The axis defining the orientation of the South Circle was taken to be the line through the geometrical centre and passing midway between the entrance posts. The interim plan shown below, based upon Wainwright’s excavation plan (Wainwright and Longworth 1971, fig. 14), was used to estimate the geometrical centre, as the Stonehenge Riverside Project’s excavation (see p. 92) had not been completed at this point; subsequent analysis did not alter this estimate. The deduced azimuth, 310°/130.4°, is critically dependent upon the accuracy of Wainwright’s north point, as discussed on p. 97.
Since the south-easterly horizon is obscured by the road embankment, its altitude (0.6° ± 0.2°) was determined by offsetting from a point on the eastern side of the road. The horizon in the north-westerly direction is formed by the rim of the henge itself. An independent topographic survey by Total Station in September 2005, taking into account the original ground level at the South Circle, which was evident from the excavation in progress, provided an estimate of the horizon altitude in the northwesterly direction of 5.0°. This estimate is subject to considerable uncertainty because of the proximity of the horizon and subsequent interference by the construction of the henge earthworks (see p. 95).
A direct measurement of the orientation of the ditch on the north-eastern side of the Avenue was obtained by CR during the 2005 excavation that uncovered it, and has since been confirmed by combining GIS data from the Stonehenge Riverside Project’s excavations with DTM data. The altitude of the north-western horizon was again estimated from the topographic survey, while the south-eastern profile was directly measurable.
The azimuth and altitude data are summarized in the Table below. All angles are in degrees.
| Structure defining orientation | Azimuth | Altitude to NW | Altitude to SE |
|---|---|---|---|
| Between centre of South Circle and mid-point between entrance posts | 310.4/130.4 ± 0.5a | 5.0 ± 1.0c | 0.6 ± 0.2d |
| Avenue | 306.7/126.7 ± 0.1b | 4.0 ± 1.0c | 0.8 ± 0.2e |
Notes:
- a: From Wainwright’s excavation plan, relying upon the north point (Wainwright and Longworth 1971, fig. 14).
- b: Orientation of the north-eastern ditch, determined by CR directly by Total Station survey during the 2005 excavation.
- c: Obtained from independent topographic survey by CR using a Total Station.
- d: Obtained by offset from a point ~50 m to the SE, from which point a theodolite survey of the horizon was undertaken.
- e: Determined by direct surey. Only adjacent horizon points were visible through vegetation, hence the slight uncertainty.
The uncertainty in the horizon altitude in the north-westerly direction is the main reason for the larger uncertainties in the declination values in this direction shown in Ch. 7 note 8.
The lunar sightlines
The azimuths of the lunar sightlnes at Stonehenge (see Ch. 7 note 26)—139.8° for the southernmost moonrise (Sightline 3) and 319.8° for the northernmost moonset (Sightline 4)—have been established on the assumption that the Station Stone rectangle is truly rectangular and hence the directions in question are precisely perpendicular to those of its shorter sides and of Sightlines 1 and 2 (49.8°/229.8° ±0.2°), as elaborated above. This may not actually be the case, and is being investigated as part of research being undertaken by the authors during 2024 and 2025.
As noted on p.73, in the absence of the intervening trees that currently obscure the view along Sightline 3, Figsbury Ring—an Iron-Age earthwork at a site that was also occupied back in the Late Neolithic—would be prominent on the south-eastern horizon 10.5km away from Stonehenge. It is in almost exactly the direction of the upper limb of the moon at its southernmost rising position around 2500 BC: its centre is at az = 141.8°, alt = +0.2°, yielding a declination of –29.8°, within 0.1° of that of the upper limb of the rising moon at the southern major standstill limit (see Ch. 7 note 26). Thom et al. (1975, 22–3; see also Thom and Thom 1978, 154–6) obtained az = 141.9°, alt = +0.2°, dec = –29.85° [they quote the geocentric lunar declination, which is –29.0°] for an ‘earth mound’ close to the centre of Figsbury Ring, and concluded that here or nearby may have been a foresight for high-precision lunar observations made from Stonehenge, although marking the centre of the moon assuming a date of 2000 BC. The Figsbury Ring earthwork, had it been built, would have framed the whole disc of the moon when rising at its southernmost limit around this time (Thom et al. 1975, fig. 2). However, the actual Station Stone rectangle alignment misses this target by some 2°.
The Station Stone rectangle alignment in the opposite direction (az = 319.8°, alt = +0.4°, dec = +28.4°) corresponds almost exactly to the upper limb of the moon at its most northerly possible setting point around 2500 BC, as noted in Ch. 7 note 26. Thom et al. (1975, table 1) obtained az = 319.9°, alt = +0.3°, dec = +28.5° [they quote the geocentric lunar declination, which is +29.35°] with their postulated foresight marking the upper limb of the setting moon around 1700 BC (ibid., fig. 1).
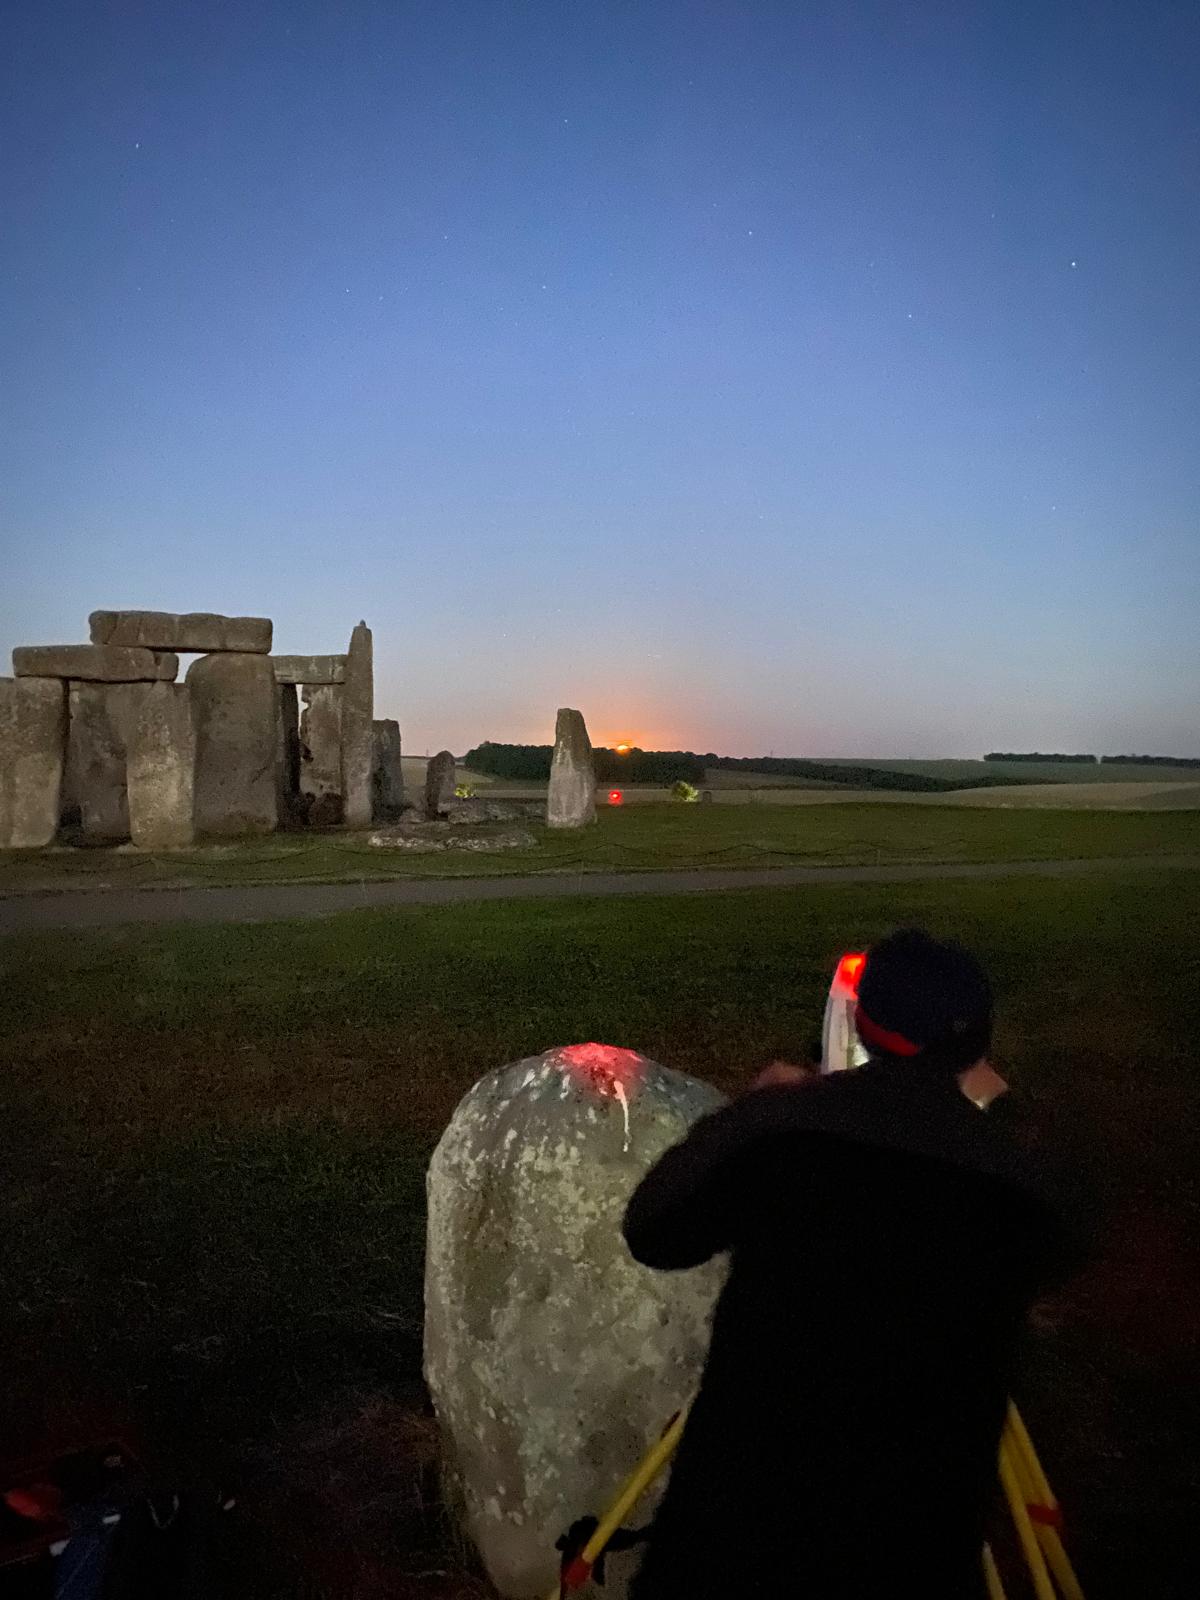
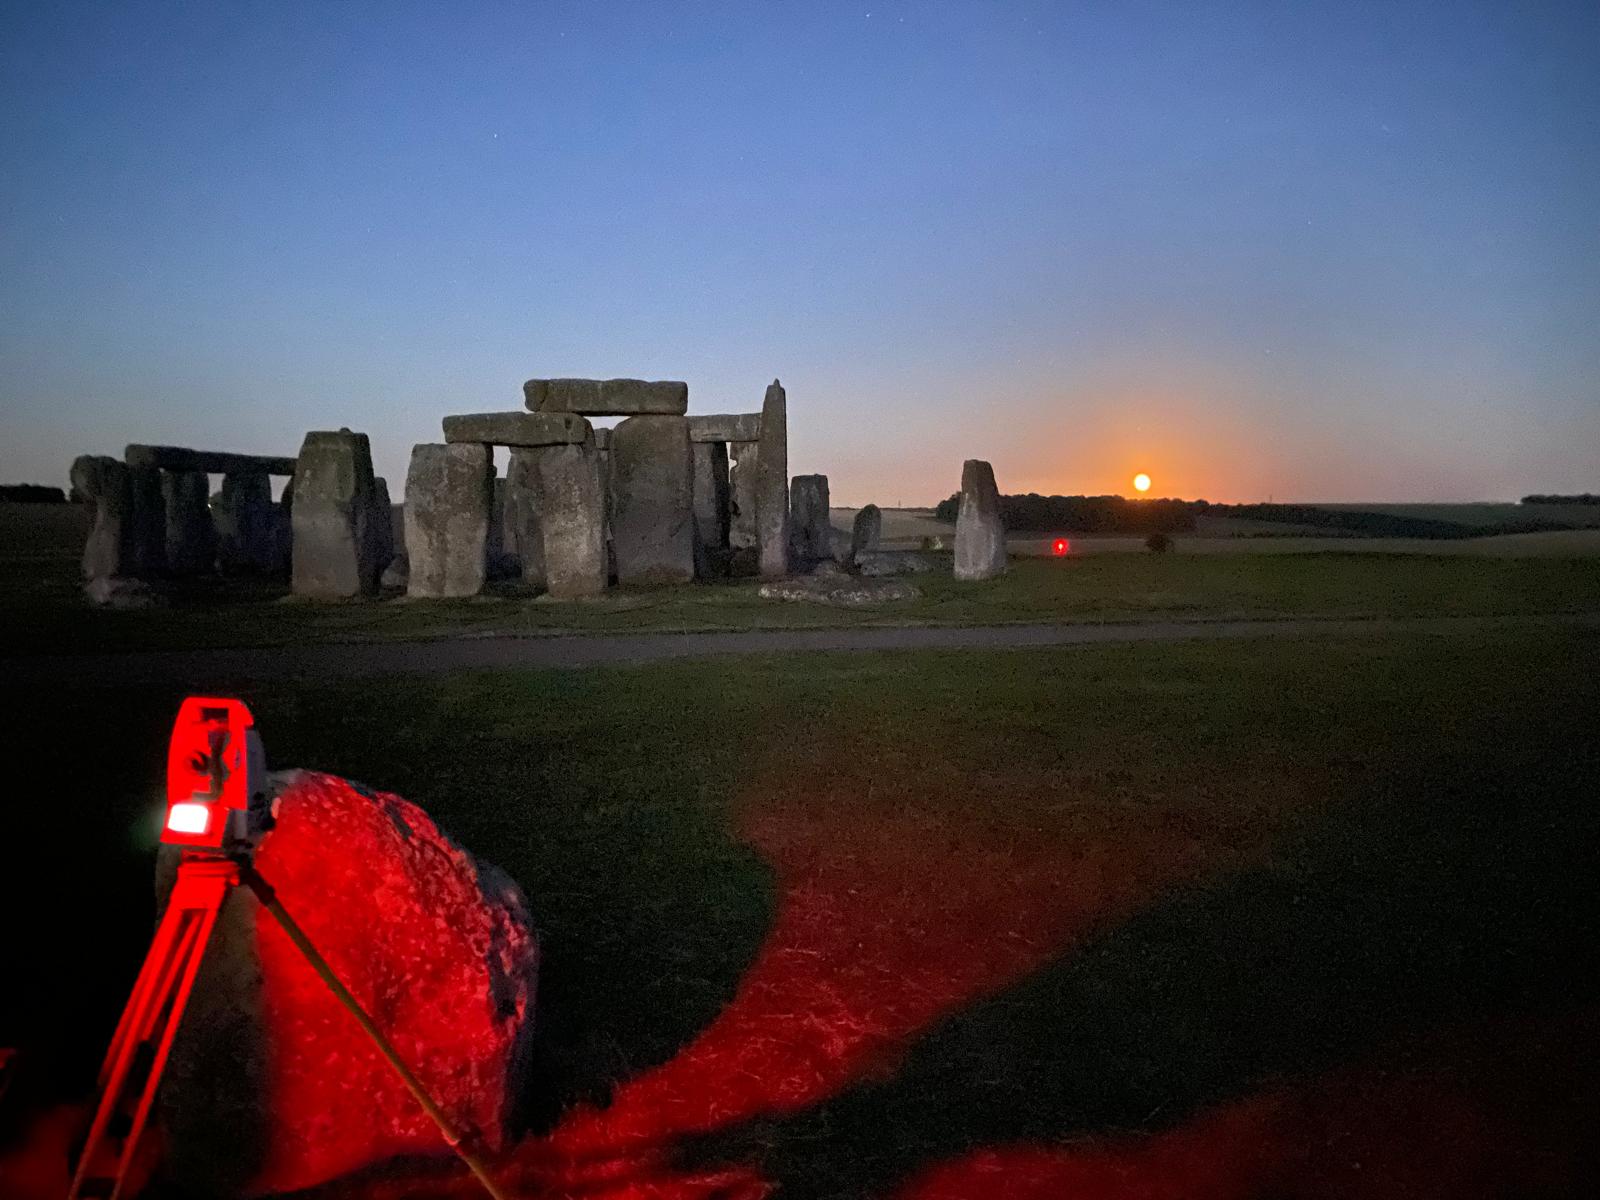
Observations around the 2024–2025 major standstill
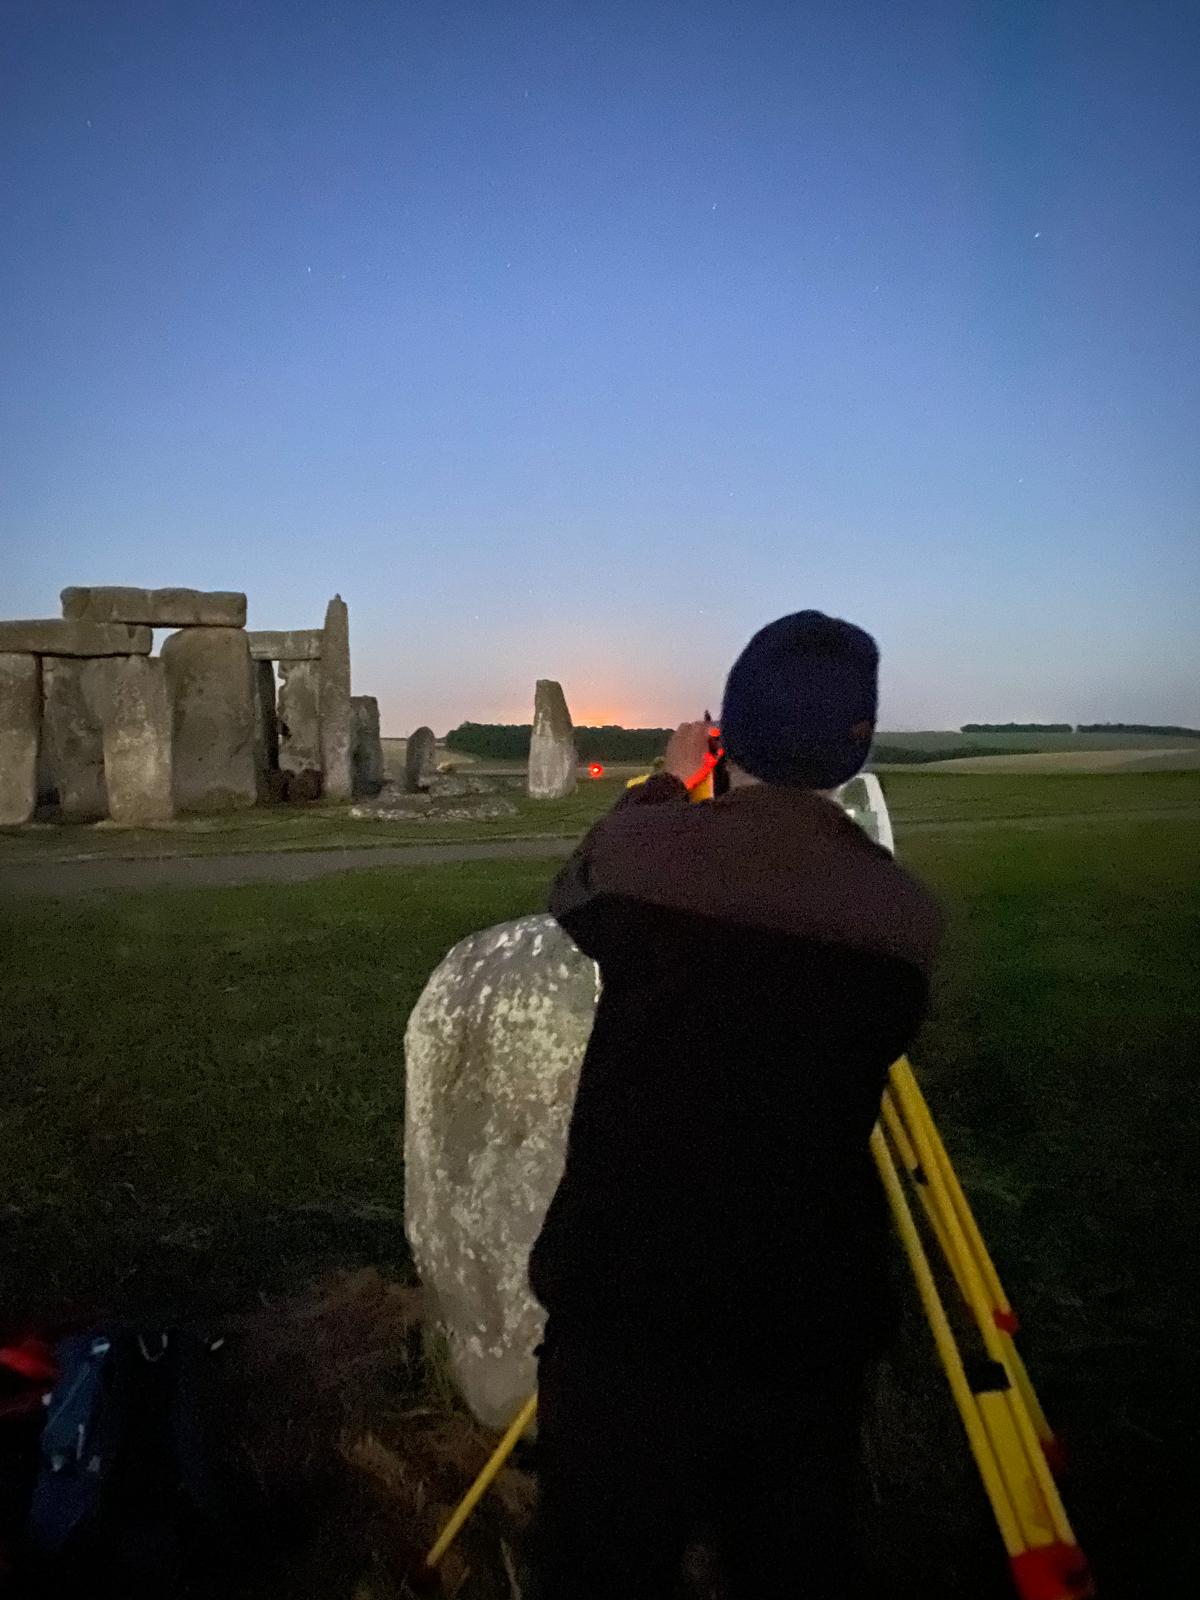
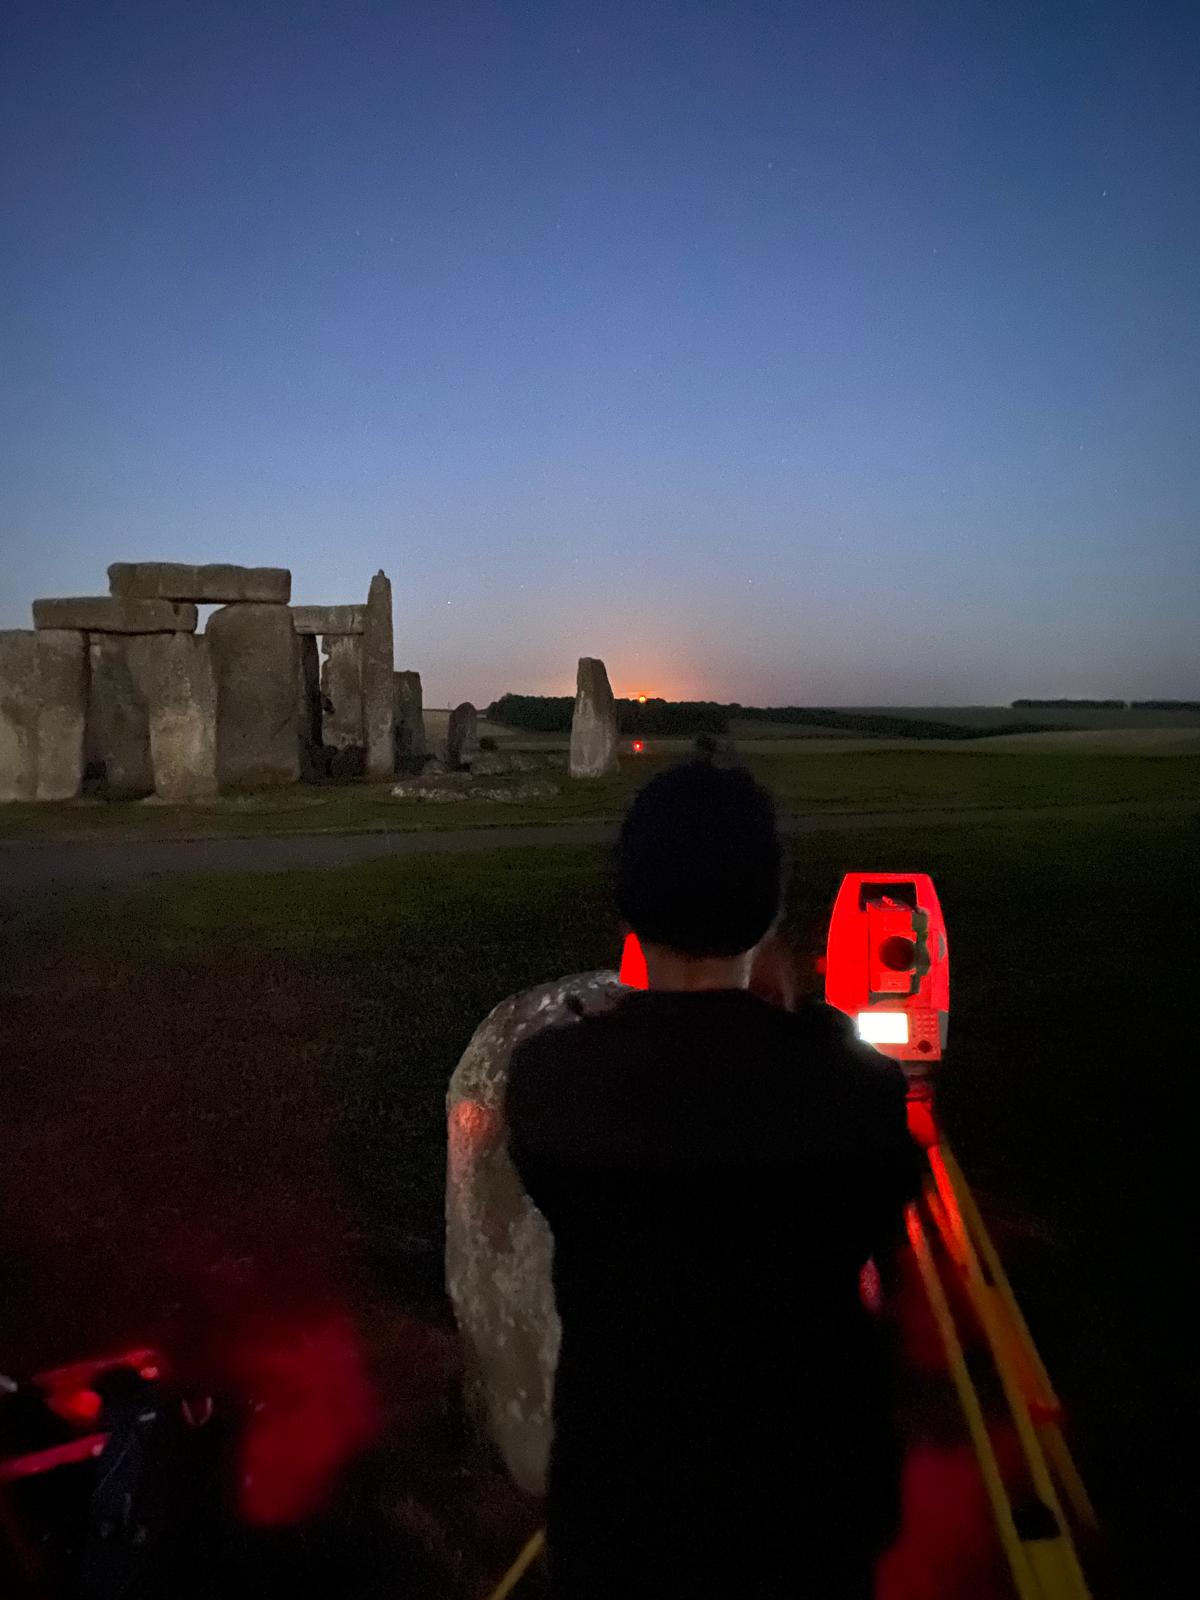
The following sequence of pictures shows our surveys of moonrise on the evening of June 22, 2024, as viewed along the SW side of the Station Stone rectangle (Sightline 3b, see fig. 5.10). Station Stone 93 is in the foreground; the red light in the distance marks the position of missing Station Stone 92.
The moon was rising at a shallow angle upwards to the right. The declination of the upper limb of the moon on this occasion was –28.8° [–27.95° geocentric], 0.6° higher than the lowest possible declination in the current era (–29.4° [28.55° geocentric]), and 1.1° higher than the lowest possible declination in 2500 BC (–29.9° [–29.05° geocentric]). In other words, the moon’s path was approximately one lunar disc higher than the lowest possible (to which it was very close on the previous night, when it was invisible owing to cloud) and two lunar discs above that of the southernmost path around the time of construction.
Owing to these differences the moon would be seen to rise on the distant horizon to the left rather than to the right of the Station Stone alignment (see p. 73), but the height of the trees currently covering the horizon almost exactly compensates for this, so that the moon made its first appearance almost exactly in the Station Stone alignment. Photos © Amanda Chadburn
Additional references
- Atkinson, Richard 1978 ‘Some New Measurements on Stonehenge.’ Nature 275, 50–2
- Pollard, Joshua 1995 ‘Inscribing Space: Formal Deposition at the Later Neolithic Monument of Woodhenge, Wiltshire’. Proceedings of the Prehistoric Society 61, 137–56
- Ranieri, Marcello 2003 ‘Geometry at Stonehenge.’ Archaeoastronomy (The Journal of Astronomy in Culture) 17, 81–93
- Thom, Alexander, Archibald S. Thom and Alexander S. Thom 1974 ‘Stonehenge’. Journal for the History of Astronomy 5, 71–90
- Thom Alexander, Archibald S. Thom and Aubrey Burl 1980 Megalithic Rings. Oxford: British Archaeological Reports 81